Documentation
Everything you need to replay a market and place hypothetical trades.
Loading a chart
Open the app and the top bar holds the setup: a symbol field with a searchable picker (type any Binance pair, or pick from your watchlist), a market selector (spot or futures), and a timeframe dropdown. Backtick opens on SOLUSDT 4h, roughly two months back, so there's something to step through immediately.

Replay vs. Live
The mode selector switches between two ways of watching a market:
- Replay — load history from a chosen start date and step the chart forward bar-by-bar (or trade-by-trade). The market is frozen until you advance it, so you can study a move at your own pace. Replay is a throwaway sandbox: it never persists.
- Live — stream the real-time Binance feed. Your hypothetical positions and chart setup are saved on this device, so a reload picks up where you left off.
Your data
Charts, hypothetical trades, drawings, and your watchlist are saved in this browser on this device. No sign-in or hosted database is needed. The live feed is still a simulation: Backtick never sends real orders.
Open the device menu at the top and choose Export backup to save a file, or Import backup to restore it on another device. Import replaces that device's current workspace. Clearing browser data removes the local copy, so keep a backup of anything you want to retain.
Previously loaded candles remain available offline. New history, tick data, and live prices require access to Binance from your browser. Hypothetical live stops and targets are processed only while the app is open and receiving prices.
Replay controls
In replay, a control bar drives time:
- Tick / Candle pill — choose whether each step advances one full candle or one individual trade (tick). Tick mode rebuilds the forming candle print-by-print.
- Speed dropdown — auto-play pace, from 1× up to 200×.
- Play / Pause (Space) — start or stop auto-advance.
- Next (→) and Prev (←) — step one increment forward or back.

Time & sales
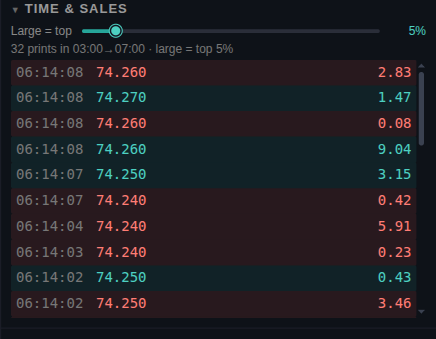
Open the Tape tab to watch individual prints stream as the chart advances. Each row is colored from Binance's real maker/taker flag:
- Green — an aggressive buy lifting the ask.
- Orange — an aggressive sell hitting the bid.
A large-prints slider highlights trades above a size percentile, so block activity stands out from the noise. In tick mode the tape and the forming candle stay in lockstep.
Footprint
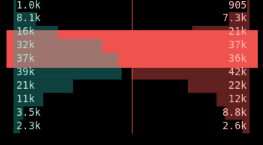
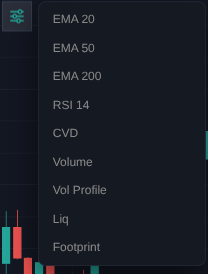
Open the Indicators menu (the wrench) and enable Footprint to break each candle into buy vs. sell volume at every price level. Zoom in to reveal the per-level numbers — it's how you spot absorption and imbalance inside a bar rather than just reading its body.
Placing trades
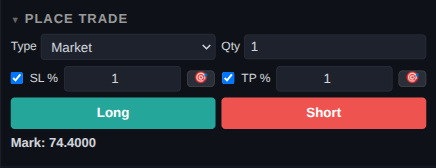
The trade side-panel places hypothetical orders against the replayed (or live) price:
- Market or Limit — fill now, or rest an order that fills when price trades through it.
- Qty — position size.
- SL% / TP% — stop-loss and take-profit as a percentage, or drag the pickers directly on the chart.
- Long (L) / Short (S) — open the position.
As you step forward, stops, targets, and limit orders resolve against each candle (or each tick in tick mode). Closed and open positions appear in the History tab.
Indicators & drawing tools
From the Indicators menu: EMA, RSI, CVD (cumulative volume delta), Volume, Volume Profile, Liquidations, and Footprint. Drawing tools include a horizontal line (H) and a measure tool (M) for sizing a move in price and time.
Keyboard shortcuts
| Space | Play / pause auto-advance |
| → | Step forward one candle / tick |
| ← | Step back one candle / tick |
| L | Open a long |
| S | Open a short |
| H | Horizontal line tool |
| M | Measure tool |
| R | Reset the zoom / price-to-bar lock |
| Esc | Cancel the active tool |
Install as an app
Backtick is a PWA. In a supported browser, use Install (desktop address bar) or Add to Home Screen (mobile) to launch it in its own window — it opens straight into the chart and works offline for the shell.